
For years, software built for one person cost too much time and money. Most of us learned to work around the products available. AI has changed that. A repeated personal process can now become software shaped around the way one person thinks and works.
My net worth dashboard came from that shift. Every few months, I used to find statements across several accounts, open them, update a spreadsheet, and reconstruct my financial picture. I wanted the finished view with the routine automated. The system now gathers the information, organises it, and presents it the way I want to see it.
That is the idea behind this build: personal software should remove personal work.
The user and the job
I built this for myself. I wanted one view that answered two questions: what am I worth, and what needs attention?
The answer spans several accounts and sources. Each follows its own format and refresh cycle. The view also reflects how I group the information and judge the overall picture.
A system for one person can use all of that context. My accounts, habits, and statement formats become part of the design.
Why the existing options fell short
Personal finance apps cover common setups well. My full picture includes sources that rarely sit together cleanly.
A spreadsheet gave me the flexibility to hold everything. The repeated work sat around it: finding statements, opening protected files, extracting the latest values, and updating the picture again.
That routine became the build brief. The system had to remove those steps and keep the flexibility of my own view.
The scope
I kept the scope personal. This tool serves my accounts and my decisions. A product for other people would need generic onboarding, broad institution support, configurable rules, and ongoing support. That work fell outside the scope.
The system gives me financial context. Investment decisions remain mine.
It also works as a balance sheet of sorts. Recent values are enough for most reviews. Automatic refreshes are easy to add where that extra freshness is useful.
Before building
Start with the view you want to see.
I often draw the dashboard on paper with a pen. I place the total, the main groups, the comparisons, and the items that need attention. Sometimes I ask AI to propose a layout. When the result feels off, I share a photo of my drawing and ask it to follow that structure.
Then grade every item:
- Must-have: needed for the first useful view.
- Nice-to-have: useful after the core view works.
The must-haves define phase 1. The rest stays parked until a real need appears. Scope grows very easily, and a long feature list can delay the first useful version forever.
The mental model: seven blocks
1. Inbox. Gmail already receives most financial statements. It contains the institution, date, attachment, and often the instructions for opening a protected file. The information begins where it already arrives.
2. Extraction. It finds the relevant emails, opens the attachments, handles password-protected files using the context in the mail, and extracts the accounts and values.
3. Store. The extracted holdings sit in a spreadsheet inside the project. The system writes and updates it. This keeps the data simple and inspectable.
4. Valuation. Some values can refresh automatically. Others can carry the value from the latest statement or review. Each value also carries an updated date.
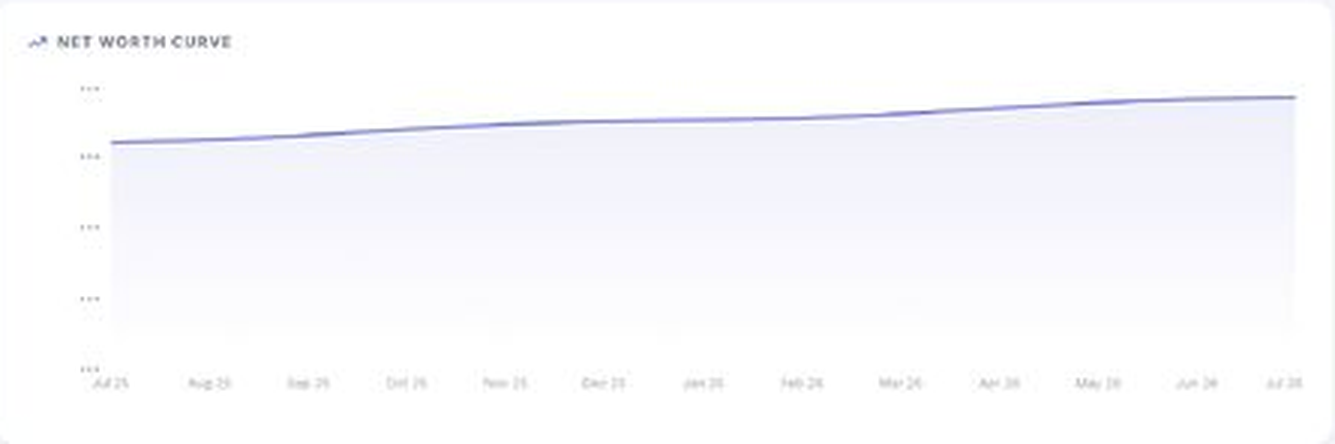
5. Views. The dashboard shows total net worth, allocation, liabilities, history, goals, and anything that needs attention. The paper sketch guides the layout.
6. Automation. The scan can run monthly as statements refresh. I personally review the dashboard quarterly at the earliest. The data is ready when I want to look at it.
7. Contingency. The same organised record can help someone trusted understand the financial picture when needed. This can come in a later phase, but it deserves a place in the design.
The build path
Step 1: scan Gmail. Search the statement emails and identify the institutions, accounts, statement dates, and attachments. Gmail already holds the raw material.
Step 2: open the files. Many statements use passwords based on personal details or a format described in the email. Use that context to open each attachment and extract the numbers. Flag exceptions for review.
Step 3: build the inventory. Write the extracted accounts, holdings, liabilities, values, and dates into a spreadsheet inside the project. The system maintains this store.
Step 4: reconcile the result. Compare the extracted inventory with the source statements. Fix the rules behind any missed account, duplicate entry, or wrong value. A reliable inventory comes before the dashboard.
Step 5: build the view. Use the sketch to arrange the total, allocation, liabilities, and changes. Add the views that support a real review.
Step 6: set the cadence. Run the scan monthly if you want it automated. Review the dashboard when it is useful. I check quarterly at the earliest.
Step 7: expand from real use. News monitoring, stress tests, anomaly checks, and questions over your own financial context can follow. Add each one when it solves a problem you have felt.
What usage looks like
The dashboard gives me one place to see a financial picture spread across unrelated systems.
I can review allocation, liabilities, changes over time, and items that need attention. The picture is already assembled. The monthly scan keeps the data ready. My own review happens quarterly at the earliest.
The values follow the needs of the review. Some can refresh automatically. Others can use the latest sensible estimate. The updated date explains the freshness of each number.
The dashboard has also grown through use. A missing answer creates the case for a new view or check. That keeps each addition tied to a real decision.
Lessons
Begin with the view. A paper sketch makes the build concrete. It also exposes which information matters.
Keep phase 1 small. Must-haves produce the first useful version. Nice-to-haves have time to earn their place.
Use the information where it already arrives. Gmail already holds the statements and the context needed to open many of them. The build should use that existing flow.
Let the system maintain the store. The spreadsheet remains useful because it is simple and inspectable. Automation keeps it current.
Match freshness to the source. Different values move on different clocks. Their refresh rules can reflect that.
Show the updated date. Freshness belongs next to the value. It gives every number context.
Reconcile history. Duplicate snapshots and parsing errors distort charts. Dedupe and validation deserve an early place in the build.
Plan for handover. A complete financial record may eventually need to help someone you trust. Clear labels and source dates make that possible.
What I would do next
I would keep improving clarity and maintenance. The most useful additions will help a trusted person understand the picture and help me see what changed since the last review.
I drew the view first, marked the must-haves, and built feature by feature. I connected Gmail at the beginning, where the manual effort could disappear. I would use the same sequence again.
This dashboard is one example of a broader shift. Your repeated process, private context, and way of thinking can now shape a useful piece of software. AI makes that practical for an audience of one.
The first useful version scans the statements already sitting in Gmail, builds the inventory, and presents the view you chose. The software carries the routine. You get the picture.